
Professor Patrick Holford of Teesside University (and also Head of Science and Education at Biocare) and Drew Fobbester are joint researchers and authors of the Food for the Brain Child Survey, September 2007 (pdf). We have previously examined the overview of the literature in this report and found that it was misleading and irrelevant. Unfortunately, the reporting and analysis of the survey data look to be even worse: there are frequent errors in the graphs and even more frequent misinterpretations. Because of these mistakes, it looks as if few of the claims are accurate.
The FFTB report was heavily publicised at its launch. Much of the publicity highlighted the purported benefits of eating dark green leafy vegetables, both for behaviour and good SAT scores. After examining the data, Holford Watch can not share the optimism for these claimed benefits and finds that there is insufficient data to support them in a robust manner.
Uncharacteristically, Holford Watch has been procrastinating. We have many unanswered questions although we approached both Professor Holford and members of the Scientific Advisory Board for guidance. We are unable to explain Holford and Fobbester’s data analysis. We shall provide a detailed analysis of some parts of it but, by way of an explanation, we thought that we might give a sample of what is making this task so unpleasant and look at the data for the consumption of dark green leafy vegetables and the claims that arise from the analysis.
A quick recap, although the headline figure for the number of children in this survey is 10,222, there are SAT scores for only 3139 of these.
Dark green leafy vegetables or are they?
FFTB’s own summary of the report states:
The best foods for good SAT scores are dark green leafy vegetables, oily fish and water. The worst foods are processed and ready meals.
Straightaway, there is a problem. The summary refers to dark green leafy vegetables, as does the report in several places. However, the report also refers to ‘dark green vegetables’ and ‘green vegetables’ in sections and contexts where it seems that the reference should be to ‘dark green leafy vegetables’.[1] Many people might categorise dark green leafy vegetables to be those like kale, several varieties of cabbage and spinach. However, dark green vegetables might include broccoli and possibly green beans as well as the foregoing; similarly green vegetables might include peas, drumhead cabbage, mangetout etc.
You might be thinking that although this inexactitude in the report is regrettable, the solution must be clear because there will be distinctly different and clear questions in the questionnaire. No. Section 12 (pg. 38) reproduces the questionnaire and it does not clarify matters. It is impossible to tell from this whether these are transcription errors (plausible given the poor standard of proof-reading of the rest of the report) or the actual questions.[2]
Diet/Intake…
Consume a serving of fresh (raw or lightly cooked) vegetables/salad?
Eat a serving of dark green vegetables?
There are methodological issues that we can not explore here such as what the respondents understood by fresh and did FFTB mean to exclude well-cooked, frozen, bottled/tinned or dried/demi-sec vegetables. However, if the question asked about dark green vegetables and omitted the word leafy, then it calls into question the claims that are made about dark green leafy vegetables. Further, if the respondents did not include well-cooked, frozen, bottled/tinned or dried/demi-sec vegetables, then FFTB is working from a different notion of 5 A Day than the one promoted by various health and government agencies.[3] If so, this again raises some serious questions about the accuracy and generalisability of the findings reported by Holford and Fobbester.
Depending on how you categorise and count these items, it might affect your estimate of the number of portions that a child eats in a week. E.g., in one week, a child might eat a portion of: Savoy cabbage, spinach, broccoli, green beans, mangetout, green pepper, peas, okra. Depending on the question, how many portions of dark green leafy, dark green, or green vegetables has the child eaten? Are the frequency reports reliable if there is any confusion?[4] If the question did not specify leafy then the respondents may have stated a frequency of consumption that the authors misinterpreted and then over-interpreted.[5]
Analysing the data for (Dark) green (leafy) vegetables
Even the above discussion can not prepare the casual reader for the confusion that is to follow. We will deal with the full data analysis in later posts, for now, we will introduce the charts and tables that detail the impact of eating these vegetables. Section 9.15 (pg. 29); the graphs are captioned, “Servings of dark green leafy vegetables”.

These two graphs purport to show the impact of the consumption of dark green leafy vegetables on behaviour (left) and academic performance (right). The cautious reader should not presume to understand what the red and green lines indicate at a glance. For now, remember that these graphs have different scales on their vertical axes, so some of the gradients and gaps are not as dramatic as they appear to be.
You will notice that x axis in both graphs has the wrong frequency categories.[6] When we present our own graphs of the data later, we use the intake table’s frequency categories from section 8 (pg. 21) which seem to be more appropriate although we don’t know how the authors handled the number 3, which may currently fall in the ‘2-3 per week’ or the ‘3-6 per week’. You may also notice that the connecting line is missing from the behaviour graph.
However, from your previous experience of interpreting well-designed graphs that present large volumes of data in a useful summary form, you might think that you can easily discern that the green line represents children with a very good diet and that there is a clear increase in both their good behaviour and academic performance as their consumption of the (dark) green (leafy) vegetables increases. However, this is just an artifact of the presentation.[7]
It was almost impossible to talk to people about these graphs without them being misled by the visually dominating appearance of a trend and gradient in the lines. We shall spare you some of the interpretations that we heard from other people[8] but we may give an overview in later posts because we have no reason to believe that other readers do not make similar misinterpretations. For now, we offer a reinterpretation of the behaviour chart in which we have restricted ourselves to correcting the frequency of consumption axis, and we have displayed the data from the both the red and green groups on the same scale. Even from this simple reinterpretation, it should be apparent that the gradients and gaps are far less dramatic.

The authors should have summarised and repeated a chart key for each chart throughout section 9 because the use of green and red overlaps with previous/later use of the colours to indicate high and non/low consumption etc. and there is room for confusion. Holford and Fobbester provide the following rubric for interpreting the graphs. However, this explanation is rather muddled and further complicated by dragging in a slightly different explanation for the SAT score graphs:
Looking at ratings of academic performance and behaviour for each child and comparing the prevalence of ‘very good’ versus ‘poor/very poor’ academic performance and behaviour ratings delivers interesting insight into the apparent positive or negative effect of different foods on these criteria. In addition the association between increasing consumption and SAT scores gives increasing insight into the relative positive or negative effect of a food on academic performance as measured in SAT scores. [pg. 22]
If we are wrong in our interpretation, we regret that, and would remind the reader that we approached Professor Holford and members of the Scientific Advisory Board for guidance although none was forthcoming. However, Holford Watch does not believe that this rubric is at all accurate. Nonetheless, it does explain some of the misleading and erroneous summary statements that accompany some of the graphs; we shall elaborate on some of these in later posts.
In addition to the appropriate interpretation of the lines, an attentive reader may be wondering if the line graphs summarise the data for ratings of behaviour and academic performance of all 10,222 children but the SAT bar graphs present the data for only 3139 children. Holford Watch explicitly asked the Scientific Advisors and Holford for clarification of both of these issues but we did not receive any assistance.
From the graphs, and primed by the discussion in the rest of the report, the immediate visual impact is that there is a clear increase in ratings of very good behaviour and academic performance as the consumption of the (dark) green (leafy) vegetables increases for one set of children. However, the graphs also seems to shows a steady decline in behaviour and academic performance for the other children as they eat more portions of the vegetable in a week, so it is tempting to interpret this as the converse, or that the degree of poor/very poor behaviour and academic performance falls as the consumption increases. However, such interpretations are misleading because there is no evidence of the sort of sub-group analysis that would be necessary to support this.[9]
As a general guide, for Section 9 the green lines in these graphs represent the children who have the best academic performance and behaviour ratings; conversely, the red lines indicate poor/very poor academic performance and behaviour ratings. As explained in footnote 7[7], the percentage numbers given on the lines do not (necessarily) add up to 100. The numbers are the percentages of those children in the frequency category, they are not the percentage of the overall group of children who have been categorised as (say) well-behaved or poorly behaved. E.g., for the left-hand behaviour graph, there is a group of children who do not eat dark green leafy vegetables:
- 25% of this group are children who have been rated poor/v. poor for behaviour
- 11% of this group are children who have been rated very good for behaviour.
There is a group of children who eat dark green leafy vegetables most days:
- 11% of this group are children who have been rated poor/v. poor for behaviour
- 28% of this group are children who have been rated very good for behaviour.
We know something of the make-up of the children for the frequency of consumption groups; we can not usefully extrapolate from these numbers. Holford and Fobbester provide the summary statement reproduced above with the graphs:
Regular eaters of dark green leafy vegetables are nearly three times more likely to be well behaved than those who never eat them. [pg. 29]
One of the difficulties here is the introduction of the word ‘regular’ but we have chosen to ignore that for the purposes of this discussion [10] because we believe that the statement is fundamentally flawed.
We must repeat ourselves on an important point: the numbers are the percentages of those children in the frequency category, they are not the percentage of the overall group of children who have been categorised as (say) well-behaved or poorly behaved. As such, you can not make meaningful comparisons about qualitative assessments of behaviour using these data. Children who are rated as very good for behaviour retain that rating irrespective of their frequency of consumption; children who are rated as poor/very poor for behaviour retain that rating, irrespective of their frequency of consumption.[9] Changes in consumption for (dark) green (leafy) vegetables can not change those categorisations on this graph. For the group who eat these vegetables ‘most days’, 11% of them are rated as poor/very poor for behaviour and 28% of them are rated as very good for behaviour; there has been no shift in the behaviour rating of those children. Both groups of children are in the ‘most days’ so the “three times more likely” comparison can not come from this group (although 28 is vaguely 3x 11). For the children in the ‘never’ category, 25% of them are rated as poor/very poor for behaviour and 11% of them are rated as very good for behaviour; again, “three times more likely” looks like a comparison of the 11% from this group with the 28% in the ‘most days’ group but both of these groups of children are rated as very good for behaviour so cannot support the comparative statement that implies very good behaviour versus poor/very poor behaviour. There is no sustainable basis for the summary statement unless you are erroneously comparing the lines and numbers as if they are indicative of a trend in behaviour rather than the composition of the food frequency of consumption groups.
Erroneous interpretations jump out because the strong lines of the graphs tell a story. These interpretations are so completely overwhelming and distracting that this form of line chart was completely inappropriate. The display style is so inappropriate that in combination with the different scales, Holford and Fobbester had to provide the percentage numbers to enable you to read the graph, but this has lead (we believe) to an error of interpretation.
Holford Watch would never have chosen to represent the data in this way. However, we feel that we ought to present some form of alternative display to demonstrate how misleading these line graphs are. We have corrected the labels on the frequency axis for the following frequency histogram and we have no way of using different scales to illustrate the red and green groups. However, it is already more difficult to (mistakenly) identify a trend on these data; the bars just indicate the percentage of children in each frequency category who belong to the red or green groups.

However, if you recall the tremendous amount of publicity given to the highlighted findings about the benefits of eating (dark) green (leafy) vegetables, you might be surprised to discover the number of children in each frequency category who represent the red and green groups. We shall reveal those tables, after we have reminded you of what the ‘SAT Score Variance with Dark Green Leafy Veg Intake’ looks like.

Holford and Fobbester have used the frequency categories from Section 8 for this chart. The columns show a very modest, steady increase in SAT scores across the frequency of consumption categories until the final column which looks like a substantial jump in scores, when compared to the other groups: 2.93, 2.96, 3.04, 3.05 and then 3.13 (however, it is possible that the authors used mode or median rather than averages here but did not mention it). However, it might be useful to remember that there are only 63 children in this final frequency group; we should also point out there there seems to be something amiss with the scores because, as reported, they yield an average SAT score of 3.02, rather than the 2.97 that the authors report elsewhere.
Holford, Fobbester, and the Scientific Advisers offer this report as their contribution to the discussion for the need for more research. FFTB already use the data from this report to make dietary recommendations for children. So, after all of these charts, the reader might be interested in knowing just how many children are represented in these columns and charts. Remaining with our exemplar of the data for the consumption of (dark) green (leafy) vegetables, we present the numbers in table form. We have created one table for the total sample of 10,222 children and a separate one for the children for whom there are SAT scores. We reverse-engineered the numbers using the frequency data from the charts in Section 9.15 (pg. 29) and from the dietary intake table in Section 8 (pg. 21).

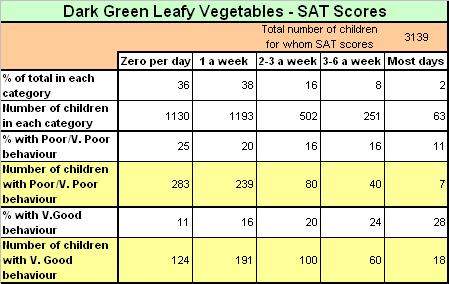
You will see that the dietary recommendations that promote daily consumption of (dark) green (leafy) vegetables because of their association with good behaviour is based on a total number of 204 children from the original sample of 10,222. There are 57 children rated as very good for behaviour and 22 rated as poor/very poor. In an unrepresentative, unweighted sample, few readers would find that at all persuasive, even if they believed it to be accurate (the mis-labelled axes and other issues to do with frequency, what the questionnaire asked etc. just add to the confusion).
Extrapolating from the table with the data for the 3139 children who have SAT scores, we see that the recommendations for daily consumption of these vegetables are based on a total number of 63 children. Concentrating on behaviour, we can see that there are 18 children rated as very good for behaviour and 7 rated as poor/very poor.
Even with the above analysis, there are many issues that we do not have sufficient information or the inclination to investigate: e.g., gender, which may have some substantial impact on the SAT scores in some categories because of the small numbers of children involved.[11]
Conclusions
Holford Watch does not have any nutritional recommendations to offer, based on these data for the consumption of (dark) green (leafy) vegetables. The data are messy and their (erroneous) analyses and their (unsubstantiated) summary conclusions are worse. There is no realistic interpretation of the data to support the summary statement:
Regular eaters of dark green leafy vegetables are nearly three times more likely to be well behaved than those who never eat them. [pg. 29]
Leaving aside the issue of the magnitude of the claim for a beneficial association for the consumption of these vegetables and behaviour, the raw numbers are far too small to support any such claim. They certainly can not support the recommendation for a daily serving of these vegetables on the basis of their purported benefits; see, e.g., ideal recommended intakes Section 4.4 (pp. 12-13)
There is negligible support for the excitement about the claimed association between the consumption of (dark) green (leafy) vegetables and SAT scores. The actual numbers involved are surprisingly low and there may be something amiss with the accuracy of SAT scores as they are reported.
We shall continue with some further analysis of the data in this survey. However, there are significant questions about the data and analyses; furthermore, as we have seen, the report is riddled with mislabelled axes and misquoted data that make it impossible to have any confidence in the reported results.
At present, we are out of sympathy with Dr Rona Tutt’s foreword to the report:
While the results do not claim to be definitive, the survey is an important step in helping to clarify what optimum nutrition really means for children.
The Food for the Brain Survey should be studied by all those who are interested in children’s mental and physical health and their general well-being. It has particular relevance to those who are in a position to influence national policy. [pg 5]
The survey has not clarified anything so far; its quality is questionable. Holford Watch hopes that nobody who is in a position to influence national policy would accept the reported findings or claims from this survey without extensive investigation.
Notes
[1] The summary refers to dark green leafy vegetables, as does the report in several places: e.g., section 4.2.1 (pg. 10), 4.3.4 (pg. 11), 4.4 (pg. 13), 7.1 (pg. 18), 7.2 (pg. 19), 9.15 (pg. 29).
Section 4.3 and 4.4 (pg. 12) refer to dark green vegetables as do sections 8 (pg. 21), 10 (pg. 32), 11.2 (pg. 35), 11.4 (pg. 36).
Just to add further confusion, other sections of the report refer to green vegetables, e.g., section 7.1 (pg. 18), 7.2 (pg. 19), 7.3 (pg. 20). Further confusion with the questionnaire indicates that these terms are not semantically equivalent and may reflect important flaws in the data collection and collation.
[2] The current form of this question does not specify leafy: Q 69 – “Eat a serving of a dark green vegetables (such as broccoli, greens, spinach, peas, runner beans)?” FFTB Children Questionnaire accessed Feb 6, 2008.
[3] Why did the Scientific Advisory Board agree to deviate from the usual understanding of what constitutes a serving of vegetables? This would severely limit the generalisability of the data if you believed them to be worth generalising.
It seems plausible that if the respondents answered the questions as quoted from the questionnaire,[2] they may well have omitted vegetable servings that would count under government guidelines such as, e.g., frozen cabbage and spinach etc. It is possible that some respondents under-reported both the consumption of dark green vegetables and vegetables in general.
If this happened, then there is a methodological flaw that led to some serious under-reporting in the absence of an explanation as to why the questionnaire specified raw or lightly cooked vegetables.
[4] Why did the Scientific Advisory Board agree to the use of a non-validated questionnaire? Researchers use validated questionnaires precisely because you need to understand how respondents interpret and answer questions and likely sources of error.
[5] If the question did not specify leafy, then, e.g., some parents will have reported that their children eat (dark) green vegetables most days. Holford and Fobbester transformed this into the claim that these children eat dark green leafy vegetables most days and based their extrapolations for behaviour and SAT scores etc. on a false foundation.
[6] You will notice that x axis in both graphs has the wrong categories for frequency; in the graphs reproduced from the FFTB report, it ranges from ‘none’ to ‘most days’ via ‘2-4 a day’ and ‘4-7 a day’ which is plainly wrong. Even correcting ‘day’ to ‘week’, these frequency categories differ from the table in Section 8 (pg. 1) where the categories are: ‘0 per day’; ‘1 per week’; ‘2-3 per week’; ‘3-6 per week’; and ‘most days’.
[7] But, if that is true, conversely, it looks as if there is a steady decline in both behaviour and academic performance for the children represented by the red line, who have a Poor/Very Poor diet. This is more obvious in other graphs, but, if this interpretation were true, then the percentages on each line should add up to 100% but they don’t always. Here, e.g., the red line figures add up to 88% in the behaviour graph; for academic performance, the green line figures add up to 112% and the red to 98%.
[8] The green and red lines do not indicate high v. non/low consumers of a foodstuff. This was tempting but, by the later categorisation of the diets (not that we understand it), it seems implausible to have a child with a Very Good diet who never eats oily fish, (dark) green (leafy) vegetables, nuts and seeds etc. Again, the apparent trends would be wrong, as in these graphs, when you would expect a foodstuff to have a beneficial impact. E.g., it would be counter-intuitive to anticipate a steady decline in both behaviour and academic performance for the children who have a Poor/Very Poor diet as they eat more portions of the vegetables in a week.
[9] If you wish to highlight changes in behaviour or academic performance that co-occur with the frequency of consumption of foodstuffs etc. then you need to provide inter- and intra- group analyses. The authors do not say that there is sub-division or intra-group analysis of the qualitative assessment of the behaviour or academic ratings and there is no axis on these graphs that can describe such a phenomenon. E.g., we do not have children who are rated as very good for academic performance but are placed in percentiles within that group, such that (say) 10% per cent are at the lower end of that subjective assessment and 5% at the upper end. There is no evidence at all to suggest that such notional percentiles are represented as the lines trend up with increasing consumption of the dark green leafy vegetables here, moving from the lower-scoring well-behaved children to the higher-scoring well-behaved children.
[10] Having introduced the word ‘regular’, there is no indication as to whether the authors are referring to the group who eat these vegetables on ‘most days’, or if they have included the group that eats 4-7 (or, 3-6 according to the table) portions a week. However, after running the calculations, mapping ‘regular’ to either of these interpretations does not help because the statement is flawed.
[11] When interpreting data for academic performance, the reader needs to bear in mind that:
girls are more likely than boys to perform well academically (Girls 26% very good versus 16% of boys). [claim not evaluated: section 6.3, pg. 17]
If this is true, then it further questions the generalisability of the data. In the original graphs that we quoted from the FFTB report you will see that the numbers in the behaviour graphs and academic performance graph are very similar. So, extrapolating from the tables we created should give broadly comparable results. The reader has to wonder how many of the higher SAT scores were achieved by girls from the c. 60 children in the group and whether there is an unexplored gender difference.
Further Reading
Food for the Brain Child Survey 2007: The Promotion
Holford Watch looks at the literature review:
Food for the Brain Child Survey 2007: Review Part 1
Food for the Brain Child Survey 2007: Review Part 2
Food for the Brain Child Survey 2007: Review Part 3
Food for the Brain Child Survey 2007: Review Part 4
Food for the Brain Child Survey 2007: Review Part 5
Holford Watch appeals for help to Professor Holford and two members of the Scientific Advisory Board who approved this report and then looks at the data and analyses:
Food for the Brain Child Survey 2007: Review Part 7
Food for the Brain Child Survey 2007: Review Part 8
Why Don’t Food for the Brain Report Their Survey Results on Supplement Pills Survey: Review Part 9
Food for the Brain Child Survey 2007: Review Part 10

To quote the Rt. Hon John Reid, this report is clearly “not fit for purpose” so I wonder to what other use printed copies might be put?
Maybe a large batch could be pulped and used as mulch for growing dark green leafy vegetables (DGLV’s)? Then others could be stacked into be a handy, disposable chopping board for preparation of resulting DGLVs and still others as serving platters for same (bound to stir conversation at dinner parties: “Oh look, this graph says when I’ve eaten the contents of this plate I’ll have boosted my SAT scores by 0.01 percent!… Oops, no it doesn’t that trend line was a smear of salad dressing” and “Anyone for coffee? Guaranteed to lower your IQ!“).
I’m sure this report has many, many uses. Except one – the promotion of this survey as a valid guide for those “who are in a position to influence national policy” on nutritional standards.
“Anyone for coffee? Guaranteed to lower your IQ!“
a maths professor of my aquaintance is fond of the saying that mathematicians are devices for turning caffeine into equations!
the questionnaire does seem quite poorly designed.
The question about cooking food in hot oil is a little confusing – since there’s surely a major difference to deep fat fried chips in year-old oil, and potato wedge lightly friend in subflower oil.
also, wrt spinach, what if one ate saag aloo very frequently – it’s fried, yet contains plenty of spinach.
I imagine that it would be a better experimental design to do follow up interviews with random survey participants to look for other factors which a (poorly designed, imho) questionnaire might miss.
do HW think the fftb survey is a serious attempt at an academic study, or is it advertising blurb for the people and organisations PH associates with?
Superburger – oddly enough, FFTB seem to think that this is a serious report. It was certainly touted that way during the media blitz when it was launched
As for me (and not necessarily other members of HW), I think that this is a lamentable piece of work that should never have been allowed out of somebody’s desk drawer. The mistakes are extraordinary. Given that, I would not want these people to have any part in follow-up interview etc.
This is one of those rare pieces of work where one has to consider whether or not it should be retracted. The errata slips would run to a ridiculous length and the conclusions and recommendations have no decent foundation.
We might have more of an opinion when we see a copy of Prof. Holford’s written submission to the FHF committee.
However, on a serious note, FFTB is now running projects in further schools. If the ‘researchers’ obtained informed consent by discussing the survey as if it lends support to some of their dietary recommendations, then the Scientific Advisory Board should consider whether or not they need to re-obtain that consent.
PS – couldn’t agree more about the cooked in hot fat question. In an earlier post on HW that mentioned the FFTB report:
Thanks, Tifosi. However, sorry to crush those dreams of finding a useful purpose for the shredded reports:
Apparently, the extensive use of shredded glossy paper with colour inks is deprecated for growing vegetables because of the heavy metal content of the inks.
Nice try, tho’. I like the way you are thinking – practical, trying to save something from the wreckage in a way that might save the face of the organic sponsors, Organix who paid for this data analysis and who provided a foreword for this report…
I see Equazen has been ordered to remove brain health claims by ASA:
http://www.foodnavigator.com/news/ng.asp?n=83128&m=1FNE208&c=ebhivpohwsvzmdw
Pingback: Food for the Brain: Child Survey. A proper job?
Pingback: Food for the Brain: Child Survey: Review Part 10 « Holford Watch: Patrick Holford, nutritionism and bad science
Pingback: Chair of FFTB Scientific Advisory Board acknowledges that their research hasn’t been “a proper job” and hasn’t been “rigorous” « Holford Watch: Patrick Holford, nutritionism and bad science
Pingback: Our Original Questions to Patrick Holford About the Food for the Brain Child Survey 2007 « Holford Watch: Patrick Holford, nutritionism and bad science
Pingback: Patrick Holford Responds to Radio 4 Programme and Misses the Point: Part 2b « Holford Watch: Patrick Holford, nutritionism and bad science
Pingback: The Economist: The End of a Childhood Illusion « Holford Watch: Patrick Holford, nutritionism and bad science
Pingback: Who Wrote About Food for the Brain in The Economist: Conflict of Interest? « Holford Watch: Patrick Holford, nutritionism and bad science